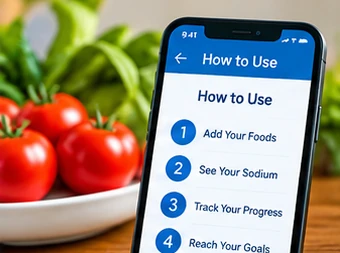
How to Use
How to use My Sodium Today and how it works under the hood.
How to Use
1. Enter a meal
Tap + Enter Meal under your name on the home page. Fill in the food name, meal type, and serving size as it appears on the food label.
For sodium per serving, enter either the milligram (mg) amount or the %DV — whichever is easier to read from the label. The other field updates automatically as you type.
Enter the number of servings you actually ate. Fractions like 0.5 and 1.5 are fully supported. The calculated sodium consumed updates immediately.
2. Today’s Info
The Today’s Info section at the top of each person’s section shows the running sodium total for the current day — in mg and as a percentage of the FDA Daily Value for adults (2,300 mg). It updates each time you add or edit an entry.
3. The graphs
Two graphs appear below your meal list.
- My Day — a cumulative line graph. Each dot represents one meal entry, positioned at its actual recorded time. The line rises with each entry and never falls. The vertical axis shows sodium as %DV.
- My Meals — a bar graph showing each individual meal entry. Bar height represents that meal’s sodium as %DV. A single meal can exceed 100% — the graph expands upward rather than cap the data.
Both graphs show three reference lines: AHA (1,500 mg), WHO (2,000 mg), and FDA (2,300 mg). Tap or click any dot or bar to see the full entry details. Use Large View to open either graph in a larger overlay.
4. Edit or delete entries
Tap any entry in the meal list to expand it, then choose Edit or Delete. Every view — Today’s Info, both graphs, Journal, and Reports — reflects the same underlying data. Editing one entry updates everything.
5. Notes
The Notes field in the meal entry form is for anything you want to remember about that entry — context, circumstances, estimates, anything. Notes are preserved exactly as you write them and appear in the entry detail, Journal, and Reports.
Multiple People
My Sodium Today supports tracking for more than one person on the same device. Each person’s meals, sodium totals, graphs, blood pressure readings, and Journal are completely separate.
- Add Person — tap the button at the top right of the home page. Enter a name and, optionally, a date of birth and reference identifier.
- Arrange by — when two or more people are added, use this control to sort by name, date added, or age. Manual ordering lets you use the arrow buttons to move people into your preferred sequence.
- Find a person — type a name to scroll directly to that person’s section.
Each person’s section on the home page is self-contained — their own Today’s Info, meal list, graphs, and blood pressure area. Data is never mixed between people.
Journal and Reports
Journal
The Journal is your detailed personal record. Navigate to any past date using the Previous / Next controls or the date picker. Each date shows that person’s individual meal entries, sodium total, and any blood pressure readings for that day. You can edit or delete entries directly from the Journal. Use the Journal for: selector to switch between people without leaving the page.
Reports
Reports let you select specific days and generate a printable sodium summary for one person.
- Select a person, then click or drag across bars in the daily graph to choose days. Days do not need to be continuous — you can combine ranges with individual dates.
- Use Find a date to locate a specific date in the graph. Use the Add Range and Add Date controls to include dates not visible in the graph.
- Click a bar to open Day Detail — a breakdown of that day’s individual meals and blood pressure readings.
- Choose Template 1 (summary) or Template 2 (summary + descriptive statistics), add optional fields such as prepared for and purpose, then tap Create Report. Use your browser’s Print / Save as PDF to save or share.
The printed graph in a report shows only the days you selected — not every recorded day. Reports are generated entirely on your device. No data is sent anywhere.
Blood Pressure
The Blood Pressure section on the home page is a simple personal log. Enter systolic (SYS), diastolic (DIA), and pulse (BPM) and tap Save. The time is recorded automatically. An optional note can be added using the + Add note link.
Blood pressure readings are stored separately from sodium data. They appear in the Journal alongside that day’s meal entries and are included in reports for selected dates. The app does not interpret readings or provide any medical assessment.
How It Works
The FDA Daily Value reference
All calculations use a single constant: 2,300 mg = 100% of the FDA Daily Value for adults. This is the same value used on U.S. Nutrition Facts labels. Every %DV figure in the app is derived from this one number. If that reference ever changed, updating it in one place would recalculate everything automatically.
mg ↔ %DV conversion
You can enter sodium per serving as either mg or %DV. The conversion is:
mg = (%DV ÷ 100) × 2,300
%DV = (mg ÷ 2,300) × 100
The field you type in is the source. The other field is derived and updates immediately as you type. Your original input — the number you typed and which unit you used — is preserved in the stored entry.
The entry calculation
Sodium consumed for one entry:
sodium consumed = sodium per serving × servings eatenFractional servings (0.5, 1.5, etc.) are fully supported. All calculations use full numeric precision. Rounding appears only in the display, never in the underlying calculation.
Stored data vs. calculated data
The stored entry contains only what you actually entered:
- Item name
- Category
- Serving size (label text)
- Sodium per serving (your original value and unit)
- Servings eaten
- Time
- Notes
Totals, %DV, daily sums, and cumulative values are never stored — they are calculated fresh every time they are displayed. This means every view derives from the same source data, and editing one entry updates everything instantly.
How the graphs work
- My Day — entries are sorted by time and plotted as a cumulative line. Each dot rises by that meal’s sodium. A zero-sodium entry produces a dot at the same level as the previous point — the line never falls. The horizontal position of each dot reflects its actual recorded time, not an equal category spacing.
- My Meals — each entry is plotted as an individual bar at its actual recorded time. Bar height is that entry’s sodium as %DV. A single entry can exceed 100% — the graph scale expands rather than cap the data.
Both graphs have fixed container heights that do not change regardless of how much data you enter. The data scale adjusts internally. The page layout stays stable.
Local storage
All data — meal entries, blood pressure readings, person profiles — is stored in your browser’s localStorage. No account is required. Nothing is sent to a server. Your data is not accessible to other websites. It persists across visits as long as you do not clear your browser’s local storage for this site. Clearing that storage removes all data permanently.